Solar Resource Maps collate the availability of ground collection of solar energy.
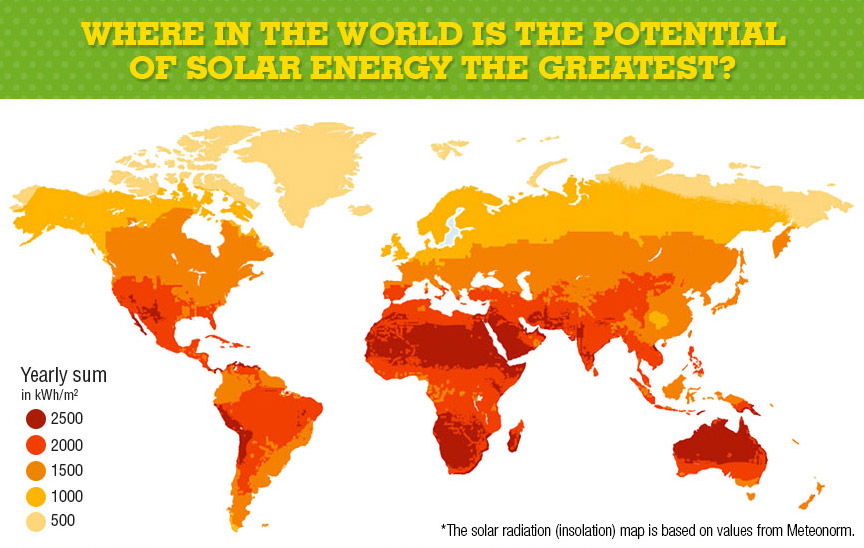 Low resolution map of Global Solar Potential, for a collector set to the horizontal. Giving us a good proxy for rooftop Solar collectors.
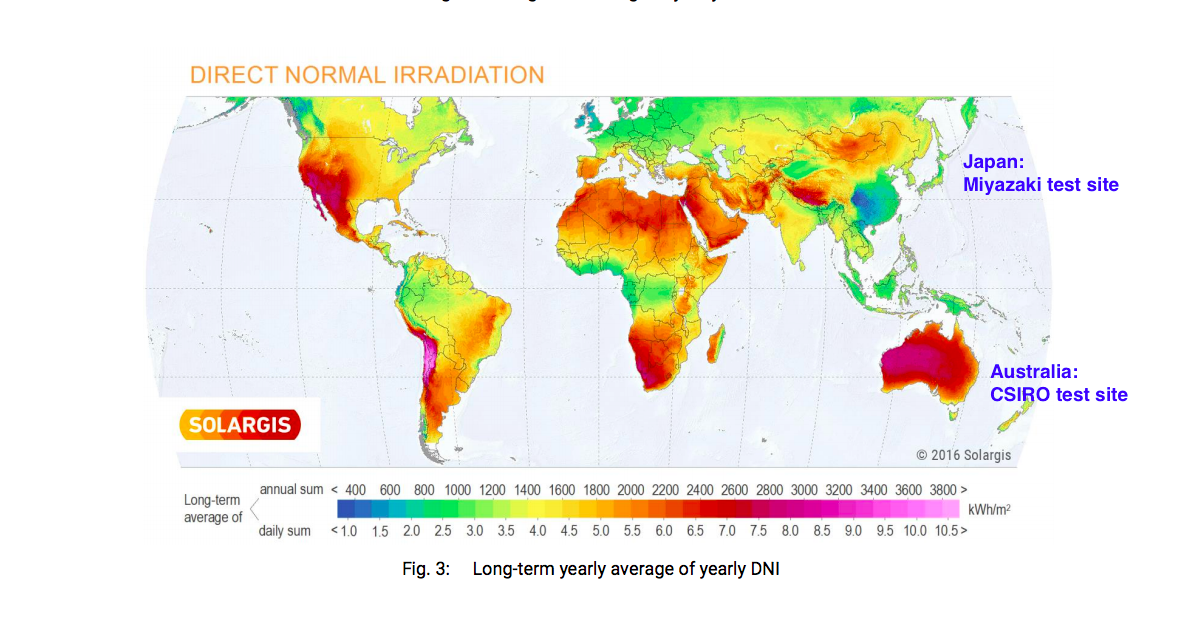 Higher resolution for Direct Normal Insolation, as part of a Solar Concentrator study. Notice the huge area in Western Australia. Australia’s Solar Resource potential is HUGE. The trick is getting it from where it’s received to where it’s needed.
 Even higher Resolution. However this is still for non-tracking Solar collectors. What if the collector tracks the Sun?
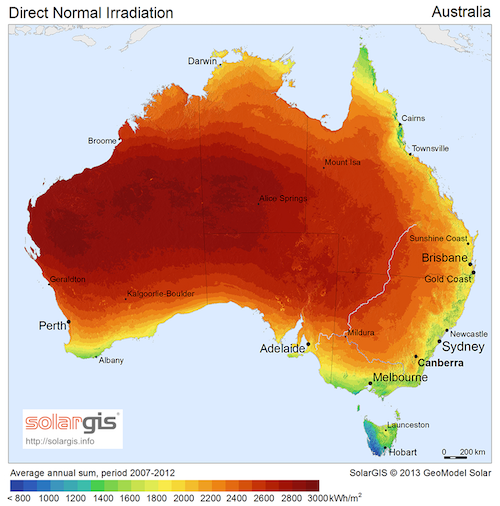
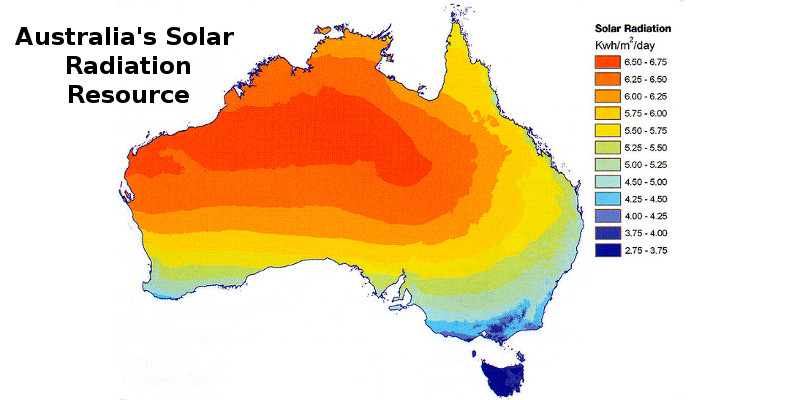 Total collection potential for a tracking system. For reference, in space, the daily insolation for a Sun-facing surface is 32.66 kW.h per day. Thus the best terrestrial resource, in Australia, achieves about 20% of that, with an average of about 6.75 kW.h per day.
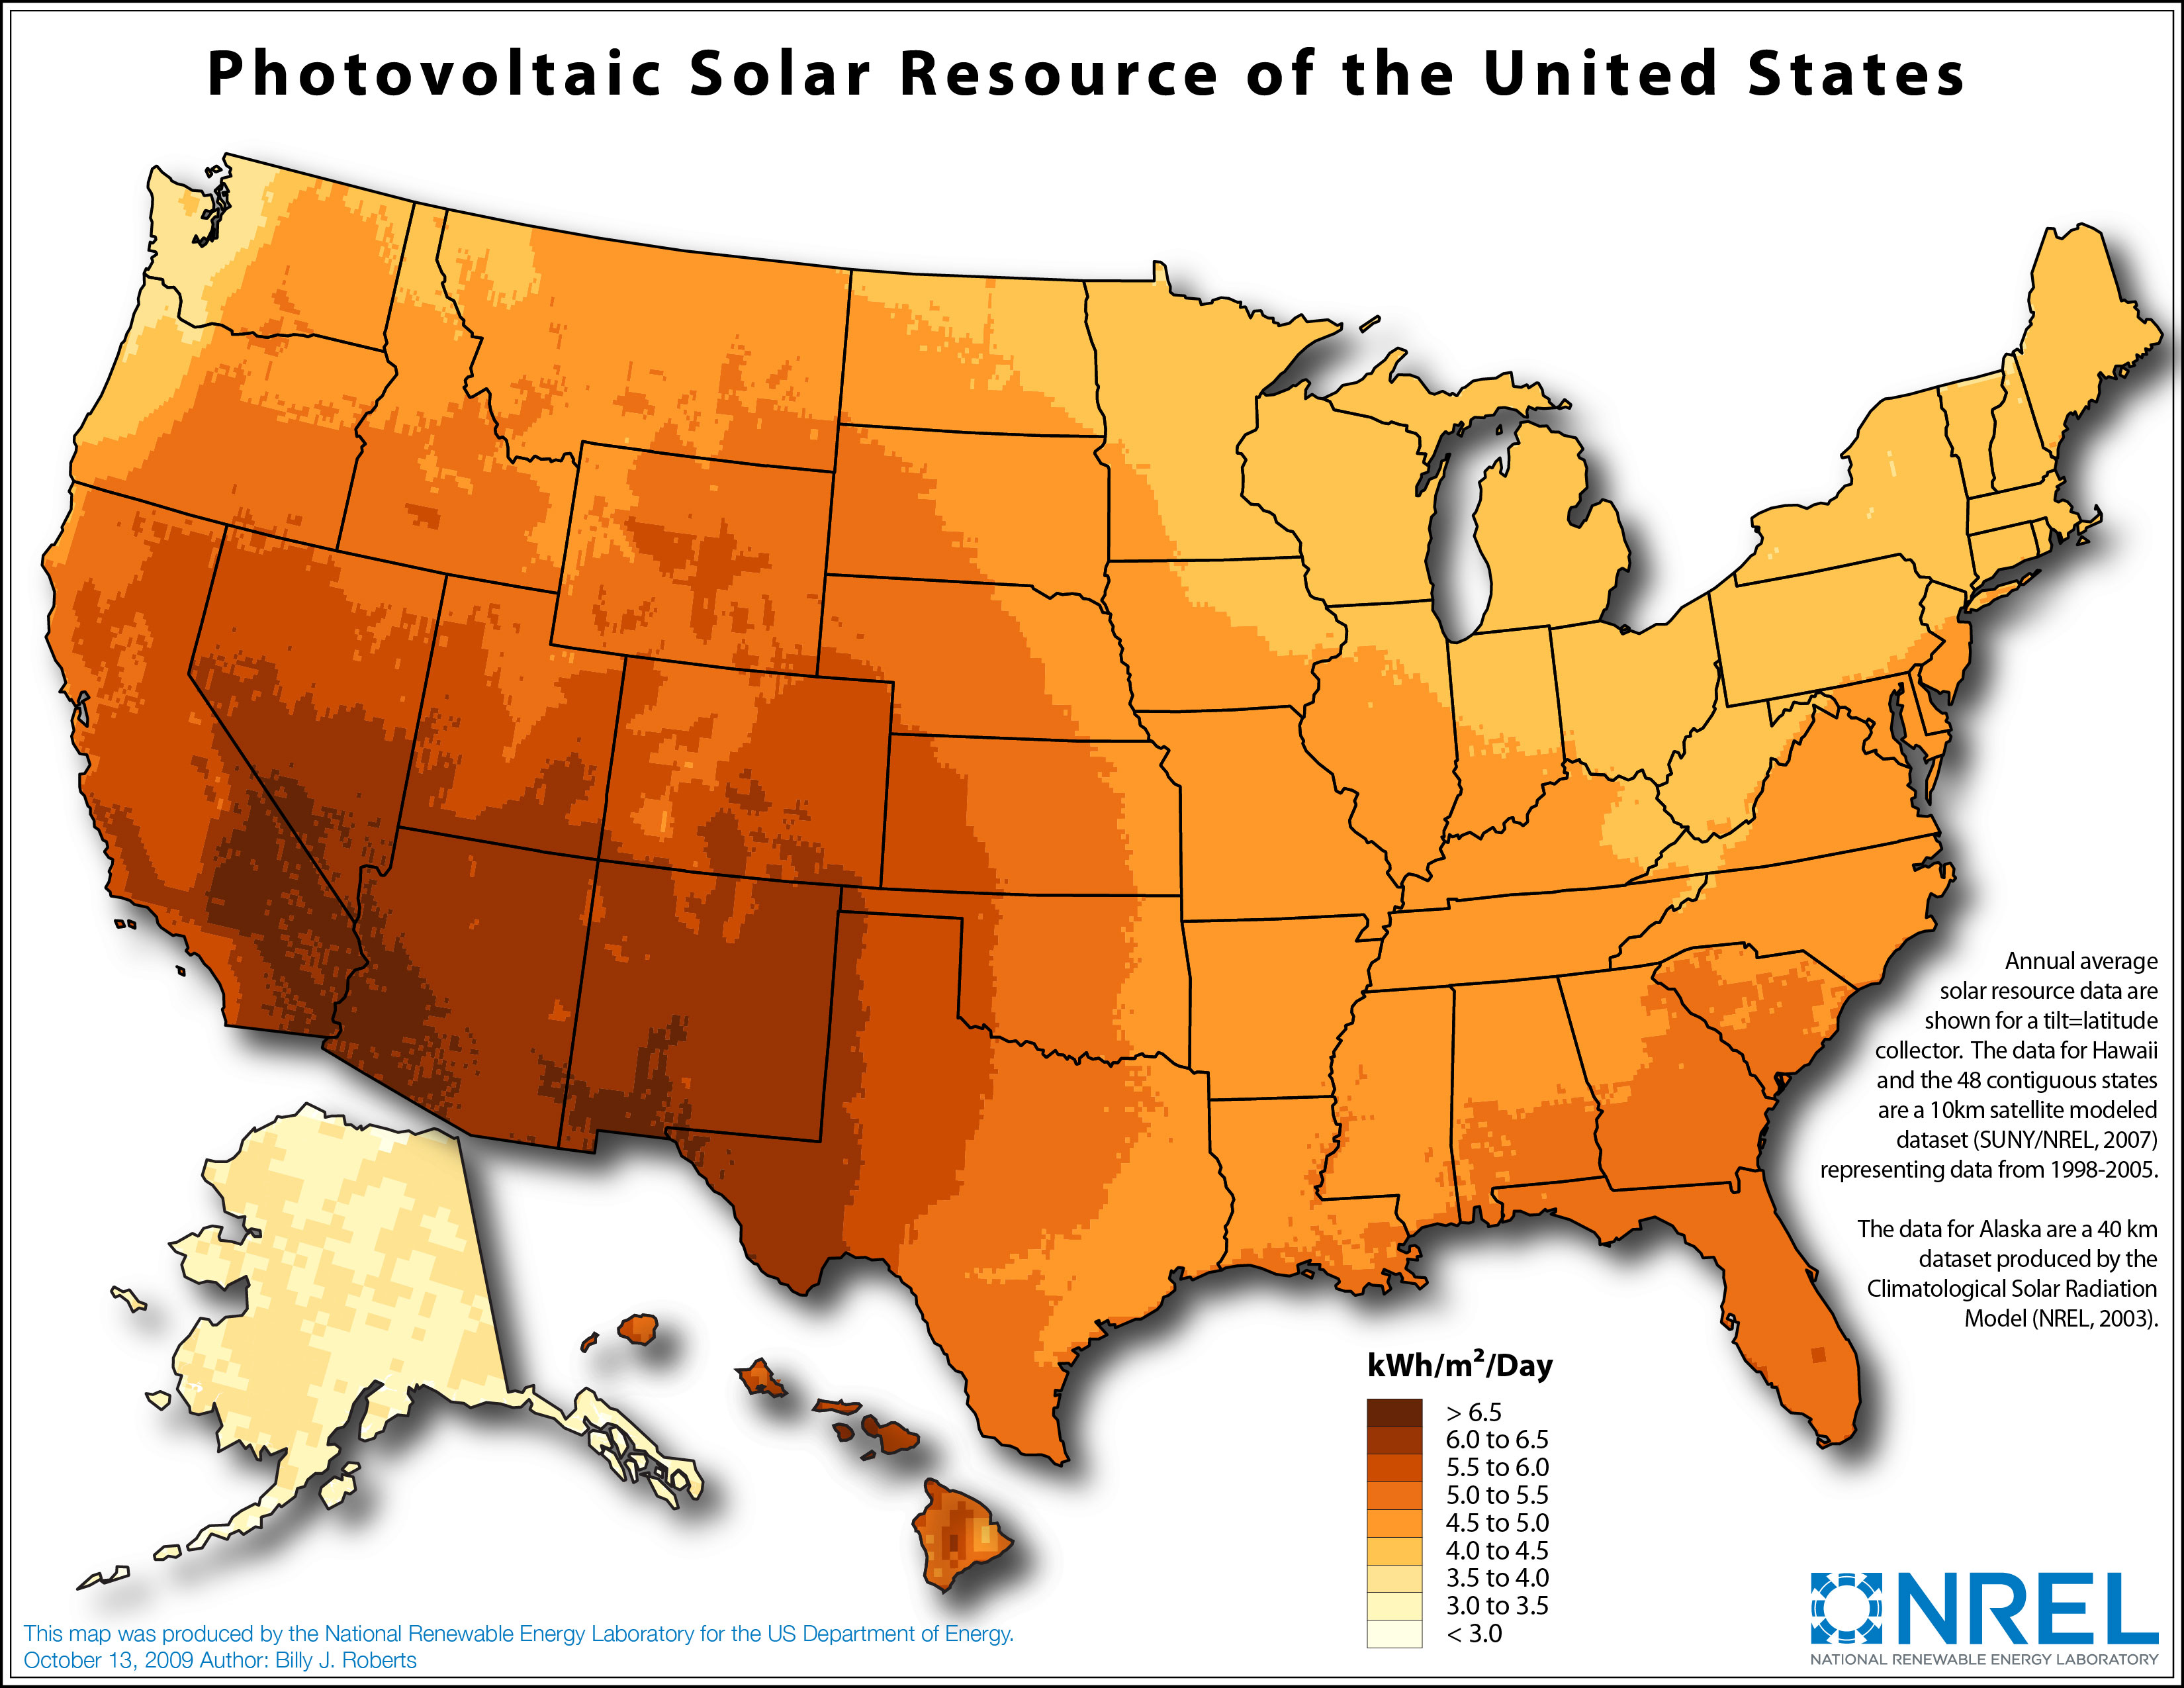 Similar map of the USA. Arizona could sell Solar to the rest of the USA, if it could be transferred efficiently.
Power lines are one way of transferring energy, but we want to also be able to store it. Breaking water via electrolysis to make hydrogen/oxygen molecules, ready to recombine in high efficiency fuel-cells is one option. For aircraft, making ammonia, which as NH3 is a hydrogen rich fuel, has gained credibility in recent years. Or, with a good supply of carbon dioxide, methane could be made and stored – natural gas already has a well established distribution system. Then there’s the increasing availability of “grid-scale” storage batteries, such as large liquid-electrolyte flow-batteries.
Doubtless some sort of solar-to-chemical or electrochemical energy will become a large part of the Storage Economy, but there’s one fundamental limitation of ground-based Solar – there’s periods when no energy is being produced. Only Space-based Solar offers (almost) continuous supply for the 8,766 hours in an average Calendar year.