From the work of Suzana Herculano-Houzel, Brazilian Neuroscientist.
[Table by Tableizer]
| Observed and Expected Cellular Composition of the Human Brain | |||
|---|---|---|---|
| According to the Cellular Scaling Rules for Primate Brains | |||
| Results are given in billions. | |||
| Expected | Observed | Difference | |
| For a primate of 75 kg | |||
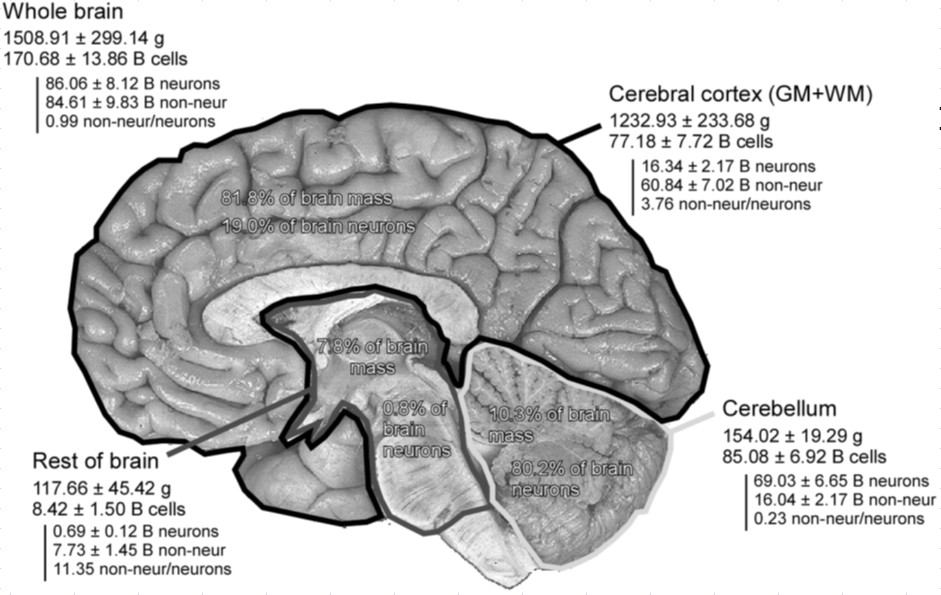
| Total brain mass (g) | 1,362 | 1,508 | 10.70% |
| Total number of brain cells | 170.97 | 170.68 | -0.20% |
| Total number of brain neurons | 78.08 | 86.06 | 10.20% |
| Total number of brain nonneurons | 94.28 | 84.61 | -10.20% |
| For a primate brain of 1,508 g | |||
| Total number of neurons | 93.82 | 86.06 | -8.30% |
| Total number of nonneurons | 113.17 | 84.61 | -25.20% |
| For a primate cortex of 1,233 g | |||
| Total number of neurons | 22.36 | 16.34 | -26.90% |
| Total number of nonneurons | 99.02 | 60.84 | -38.60% |
| For a primate cerebellum of 154 g | |||
| Total number of neurons | 77.94 | 69.03 | -11.40% |
| Total number of nonneurons | 11.26 | 16.04 | 42.40% |
| For a primate RoB (Rest of Brain) of 118 g | |||
| Total number of neurons | 0.62 | 0.69 | 11.30% |
| Total number of nonneurons | 7.17 | 7.73 | 7.80% |